Correlation & Causation: Why Your Data Might Be Lying to You
In a business world driven by data dashboards, machine learning models, and AI-generated insights, it’s easy to fall into the trap of thinking every pattern tells a story. But not all stories are true—some are just coincidental. That’s the difference between correlation and causation, and misunderstanding it can lead to disastrous decisions.

The Temptation of the Trend Line
Visualizing data is powerful. When two lines on a graph move in sync, the impulse to connect them is natural. But correlation simply means two things move together. Causation means one actually causes the other to move.
And mistaking the former for the latter? That can turn a promising strategy into a costly misstep.
When Data Gets It Wrong: The Funny Side of False Connections
To drive the point home, consider these real, statistically significant correlations:
Cheese consumption closely mirrors the number of people who die by bedsheet entanglement.
The age of Miss America winners correlates with murders by steam or hot vapors.
Declines in margarine consumption align with Maine’s divorce rate.
Nicolas Cage film appearances align with swimming pool drownings.
Chicken consumption rises in step with U.S. crude oil imports.

These aren’t cherry-picked to be funny—they're examples of real data sets with high correlation coefficients. But no logical relationship exists. They just happen to rise and fall together.
The Real Danger: Decisions Made on False Assumptions
While funny in a vacuum, false correlations can be costly when applied to real business decisions:
A dip in customer retention might coincide with a new product launch, but it could actually be caused by a poor support experience.
A marketing campaign may appear to drive traffic when, in reality, an external news event is the real driver.
When executives and analysts don't investigate root causes, they risk enacting policies, investing money, and shifting resources based on bad assumptions.
Real Causation: What It Actually Looks Like
There are instances where one thing reliably causes another. Here are a few:
Sustained drought leads to reduced crop yields, which directly drives up grain prices.
Rising fuel prices increase the cost of transportation, raising consumer prices.
Interest rate hikes make borrowing more expensive, which lowers home sales.
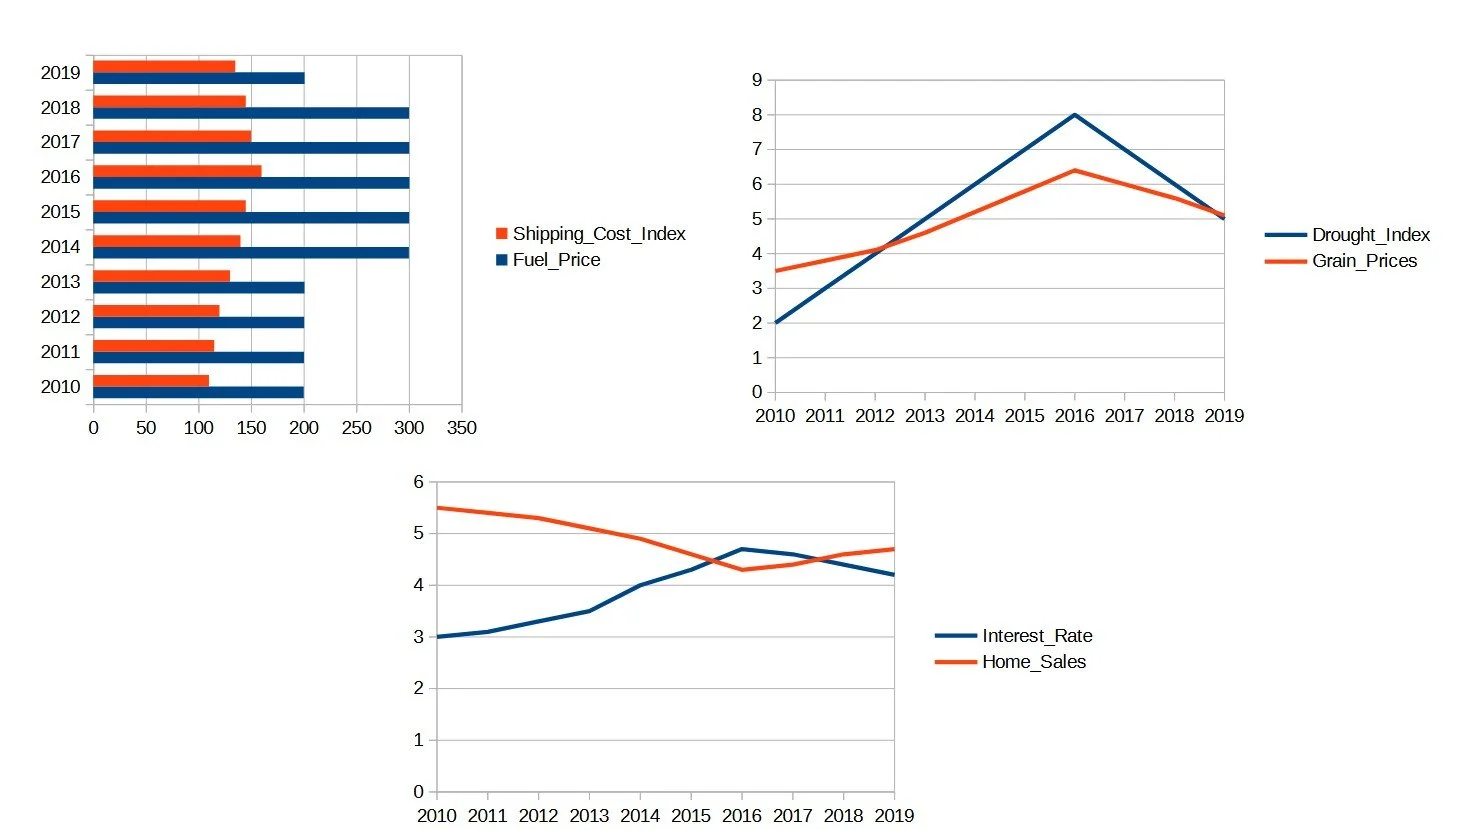
These relationships are studied, repeatable, and logically sound. They reflect causation, not just coincidence.
How to Avoid Being Fooled by Correlation
Ask Why – What is the mechanism that could logically explain this relationship?
Look for Lag – If A causes B, does B follow A consistently over time?
Test It – Use A/B testing, controlled experiments, or comparative regions/markets.
Bring in Domain Experts – Data is most valuable when interpreted with context.
Avoid Confirmation Bias – Don’t look for patterns that support your assumptions. Look for truth.
Data Is a Tool, Not a Truth
Modern analytics platforms and AI models are powerful—but they’re only as good as the logic behind them. Correlations can point you toward questions worth asking, but they don’t give you answers.
Leaders must foster a culture of curiosity and critical thinking, where data isn’t blindly followed but actively questioned.
Because in the end, the story your data tells depends on how well you understand its language.
Written by Richard Joseph, founder of Tech Lens Advisors, a consultancy focused on digital transformation, organizational change, and technology strategy. Learn more at techlensadvisors.com.